| Author: | Konstantin Rybakov |
| Publication Date: | First publication date: March 2018 Last update: March 2018 |
| Notes: | pdf:
interest_term_structure.pdf docx: interest_term_structure.docx |
| Excel tools: | Excel tool (single term structure):
term-structure.xlsm pdf screen (single term structure): term-structure.pdf Excel tool (multiple term structures): term-structure-n.xlsm pdf screen (multiple term structures): term-structure-n.pdf |
| Objective: | The tool constructs term structure of yield rates using Siegel-Nelson three-factor model. |
A more detailed description of the term structure estimation with the description of the estimation equations is provided in these notes (pdf) (and a (docx) version).
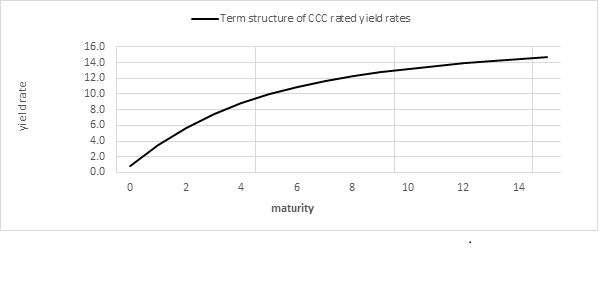
The term structure of interest rates is the relationship between interest rates or bond yields and different terms or maturities. The term structure of interest rates is also known as a yield curve. Yield curves are usually upward sloping asymptotically: the longer the maturity, the higher the yield, with diminishing marginal increases. There are two common explanations for upward sloping yield curves. First, it may be that the market is anticipating a rise in the risk-free rate. Another explanation is that longer maturities entail greater risks for the investor and therefore investors demand a higher risk premium to invest in long-term bond instruments.
Yield curves are built from either prices available in the bond market or the money market. The yield curves built from the bond market use prices only from a specific class of bonds (for instance US Treasury bonds or US corporate bonds with a given consensus credit rating). A standard approach to estimate yield curves is to approximate the bond yield data using parameterised curves (such as splines, the Nelson-Siegel family, the Svensson family, or the Cairns restricted-exponential family of curves).
The yield curve estimation based on Nelson-Siegel family of parametrized curves is a traditional approach to term structure modeling in the financial industry (Bolder D and D Stréliski, "Yield Curve Modelling at the Bank of Canada", Technical Report No. 84, Bank of Canada, February 1999). The unknown parameters f1,f2 and f3 are referred to as model factors and are interpreted as follows: (i) f1 is the term structure level factor; (ii) f2 is the term structure slope factor; and (iii) f3 is the term structure curvature factor.
The unknown parameters are estimated as follows:
- Select parameter α of the Nelson-Siegel curve family. There are
several methods to estimate the &alpha parameter that have been recommended in the literature
(Jan Annaert, Anouk G.P. Claes, Marc J.K. De Ceuster, Hairui Zhang, "Estimating the Yield Curve
Using the Nelson-Siegel Model: A Ridge Regression Approach", Universiteit Antwerpen, Belgium,
Louvain School of Management, Belgium):
- Diebold-Li: α=1/1.37;
- Fabozzi: α=1/3.0;
- Nelson-Siegel: estimate parameter α, which maximizes the R2 goodness-of-fit measurement of the Nelson-Siegel linear regression model.
In practice the three options typically produce similar results. - Run ordinary least square (OLS) method to estimate parameters f1, f2 and f3 of the Nelson-Siegel linear regression equation.
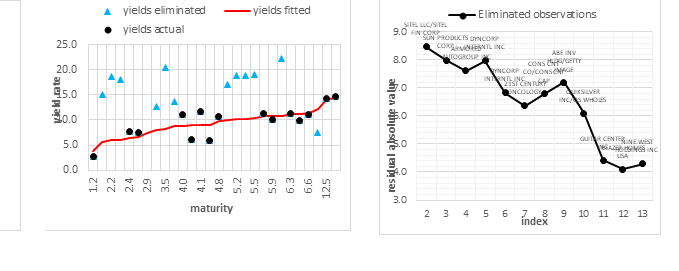
Presence of the outliers in the sample results in the biased and unstable estimation of the yield term structure. Therefore we apply the following procedure to remove the outliers from the final sample.
- Estimate parameters f1, f2 and f3 and α of the Nelson-Siegel family of parametrized curves as described above;
- Identify the bond i with the largest absolute value of the error term εi (which measures the deviation of the yield rate yi from the estimated term structure);
- Remove bond i from the sample and repeat from step 1 until all error terms εi are less in absolute value than a certain selected threshold value.
To summarize, the term structure of the yield rates was estimated as follows (the estimation is illustrated for the US corporate CCC rated bonds issued by companies operating in broad industrial sector):
- We searched for the US$ denominated bonds issued in US by companies operating in broad industrial sector that have a Caa2/CCC credit rating reported consistently by both Moody's and S&P rating agencies. Estimate the yield rates yi as of the valuation date of the analysis;
- We removed the outliers from the sample as described above;
- We estimated the yield term structure using Nelson-Siegel family of parametrized curves and a final sample of bond yield rates yi
Results of term structure estimation are illuystrated in the diagrams below.